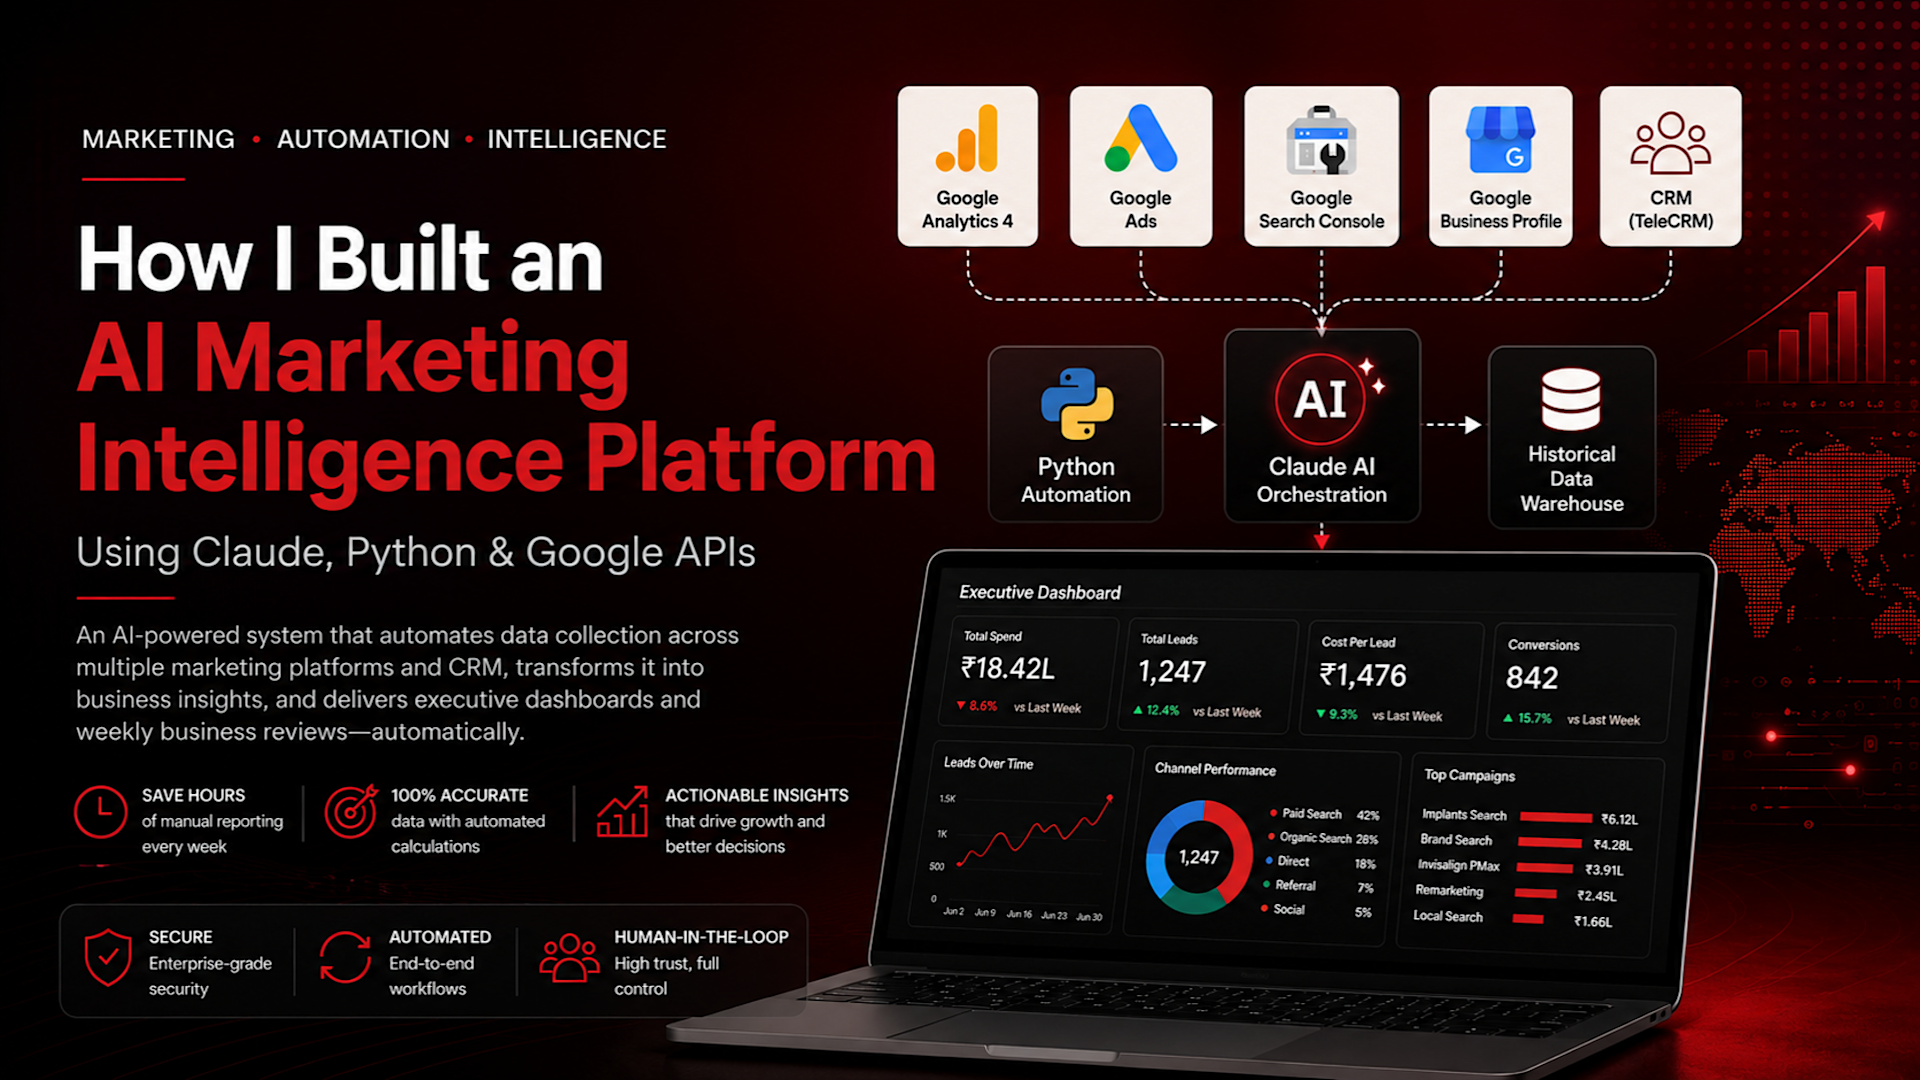
How I Built an AI Marketing Intelligence Platform Using Claude, Python & Google APIs
Marketing reporting is one of the last truly manual processes left in most businesses. Every week, someone logs into Google Analytics, Google Ads, Search Console, Google Business Profile, and a CRM, exports numbers into a spreadsheet, recalculates a few ratios by hand, and pastes the result into a slide deck for an executive meeting. I did this myself for a multi-location local business running paid search, SEO, and local marketing across several physical locations — and I got tired of it fast.
This is the story of how I built an AI marketing intelligence platform that replaced that entire manual loop. It combines Python automation, native Google APIs, a CRM data layer, and Claude acting as an orchestration layer that reads documented procedures and executes them the way a well-trained analyst would — not through one-off prompts, but through a repeatable, auditable system. The result is a platform that fetches data across four marketing channels and a CRM, merges it into a historical data warehouse, builds a live reporting workbook, generates executive dashboards, and produces a Weekly Business Review (WBR) with almost no manual intervention — while still keeping a human firmly in control of every credentialed, high-trust operation.
If you're evaluating Claude, AI agents, or marketing automation for your own operation, this is a real system architecture, not a proof of concept. The goal of this article is to walk through the architecture, the workflow, and the engineering decisions in enough depth that you could design and build something equivalent for your own business — without exposing the internal file names, data schemas, or business-specific details of the system I actually run. Think of it as a blueprint, not a leaked source repository.
The Problem: Marketing Teams Spend Too Much Time Building Reports
Reporting Exists Across Too Many Platforms
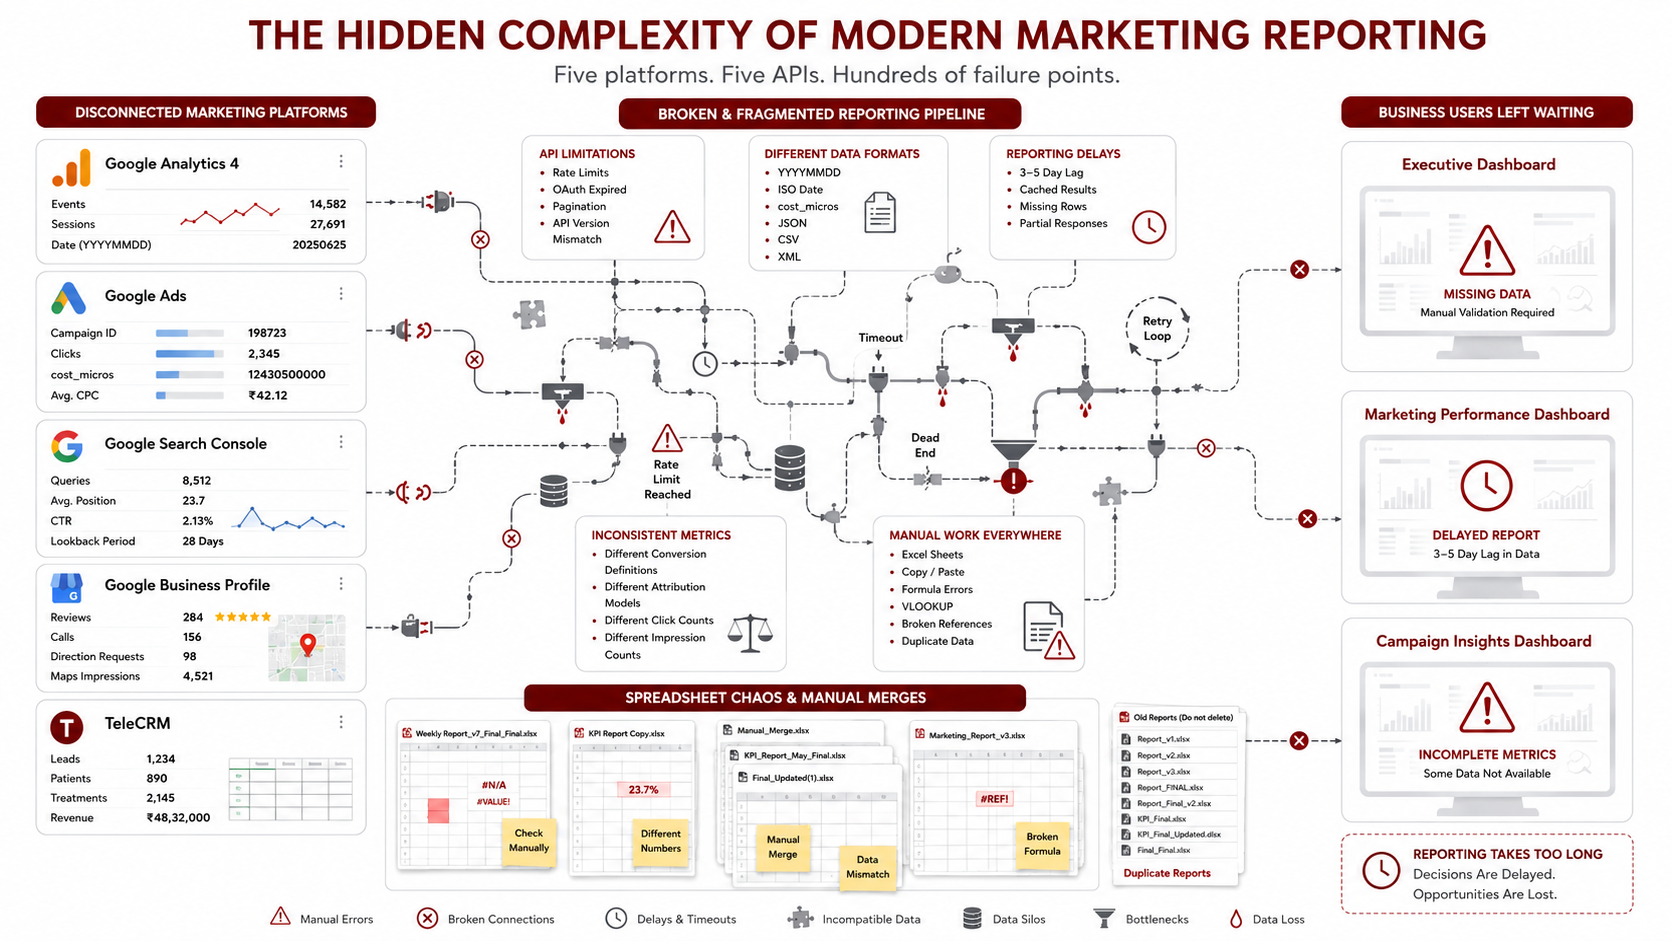
A single marketing operation today touches at minimum four separate systems: an analytics platform (Google Analytics 4), a paid media platform (Google Ads), an organic search platform (Google Search Console), and a local presence platform (Google Business Profile). Layer a CRM on top — Salesforce, HubSpot, Zoho, LeadSquared, Freshsales, or in this case TeleCRM — and you have five systems, none of which talk to each other, each with its own login, its own data model, and its own definition of what a "conversion" or a "lead" means.
For the dental clinic group behind this project, that meant ten Google Business Profile listings, one GA4 property, one Google Ads account running a mix of Search and Performance Max campaigns, one Search Console property, and a CRM tracking over 4,000 leads and nearly 15,000 treatment records. None of it lived in one place. None of it was comparable week over week without manual work.
Every Platform Has Different APIs
Beyond the sheer number of platforms, each one exposes data differently. Google Ads returns cost in micros (you divide by 1,000,000 to get currency). GA4 returns dates as `YYYYMMDD` strings with no separators. Google Search Console's reporting API has no `start_date`/`end_date` parameter at all in its most common form — it only accepts a `days` lookback window and a row limit, and if you pass date parameters anyway, it doesn't throw an error. It silently falls back to defaults and truncates your results, which is arguably worse than a hard failure because nothing tells you it happened. Google Business Profile splits performance data and reviews across two different APIs (`businessprofileperformance.googleapis.com` and `mybusiness.googleapis.com`), enforces an 89-day maximum chunk per call, and reports different metrics on different lags — map impressions and direction requests update same-day, while search impressions, calls, and website clicks lag three to five days.
None of these are edge cases. They are the default behavior of the APIs you have to build against, and every one of them is a place where a manual process — or a naive automation script — quietly produces wrong numbers.
Executives Need Business Insights, Not Raw Metrics
None of this raw data is useful to a clinic director or a marketing manager on its own. Nobody in a Monday leadership meeting wants a table of `sessionDefaultChannelGroupName` filters or `cost_micros` values. They want to know: how much did we spend, how many leads did that produce, what did each lead cost us, and is that trending up or down compared to last week. Translating ten raw data feeds into four or five business-readable numbers — Cost Per Lead, weighted Click-Through Rate, weighted Average Position, and week-over-week deltas — is where most of the actual manual effort goes, and it's also where manual processes are most error-prone, because these are not simple averages. A weighted average position, for example, has to be calculated as Σ(position × impressions) ÷ Σ(impressions) — a simple mean across days is mathematically wrong, and it's an easy mistake to make by hand in a spreadsheet.
Why Traditional Automation Breaks Down
The obvious next step is "just write a script." And to a point, that works — a script that pulls data from an API on a schedule is genuinely useful. But traditional automation breaks down in a specific way: it's brittle in the face of anything that isn't the exact case it was written for. A cron job that pulls Google Ads data doesn't know what to do when a new campaign launches with a name that doesn't match its hardcoded list. A script that overwrites a JSON file every night silently destroys historical data the moment an API has a bad day and returns partial results. A dashboard generator that assumes twelve months of clean columns breaks the first time a month boundary falls in the middle of a Sunday-to-Saturday reporting week.
Traditional automation is also purely mechanical — it has no judgment. It cannot notice that this week's Search Console numbers look truncated because a parameter was silently ignored. It cannot recognize that a new campaign needs a new row added to a specific sheet. It executes exactly what it was told, nothing more, which means every new edge case requires a developer to go back into the code. This is the ceiling that traditional marketing automation and most **AI marketing automation** buzzword products run into: they automate the retrieval, but not the judgment, validation, and adaptation that a human analyst brings to the process.
Why I Built an AI-First Marketing Intelligence Platform
The Original Goal
The initial goal was modest: automate the weekly Excel report so I didn't have to manually copy Google Ads and GA4 numbers into a spreadsheet every Monday. That's it. A single script, a single output file.
Why Python Alone Wasn't Enough
Python alone handles the mechanical part well — API calls, data transformation, writing to Excel with `openpyxl`. What Python alone doesn't handle is the orchestration: deciding what to fetch, in what order, how to merge new data with what already exists without corrupting history, how to detect when a data source is returning something is off (like GSC silently truncating to a default window), and how to adapt to new campaigns, new months, or new leadership questions without a developer rewriting code every time. A hardcoded script is a snapshot of a decision made once. The actual reporting process needed something that could hold and apply *procedure*, not just *logic*.
Moving from Automation to AI Operations
That's the shift that mattered most in this project: moving from "automation" (a script that does one fixed thing) to **AI operations** (a system where an AI agent reads a defined procedure, executes the right sequence of tools, checks its own output, and adapts within guardrails). The distinction sounds subtle, but it changes the entire design. Instead of one script trying to handle every case, the architecture became: deterministic Python scripts that do one job precisely, and an AI orchestration layer — Claude — that knows which script to run, when, with what inputs, and how to validate what came out.
Treating AI as an Operational Team Member
The mental model that made this work was to stop treating Claude as a code-generation tool and start treating it as an operational team member with a defined role — the same way you'd onboard a new marketing analyst. A new analyst doesn't get a blank slate; they get a documented SOP: what to fetch, in what order, what the known gotchas are, what "done" looks like. That's exactly what this system gives Claude, SOP documents in a 'Docs/' folder that specify the exact MCP calls, parameters, merge rules, and script execution order for both the weekly Marketing WBR and the on-demand CRM refresh. Claude doesn't guess at the workflow each time; it reads the same operational procedure a human team member would follow.
Marketing Platforms
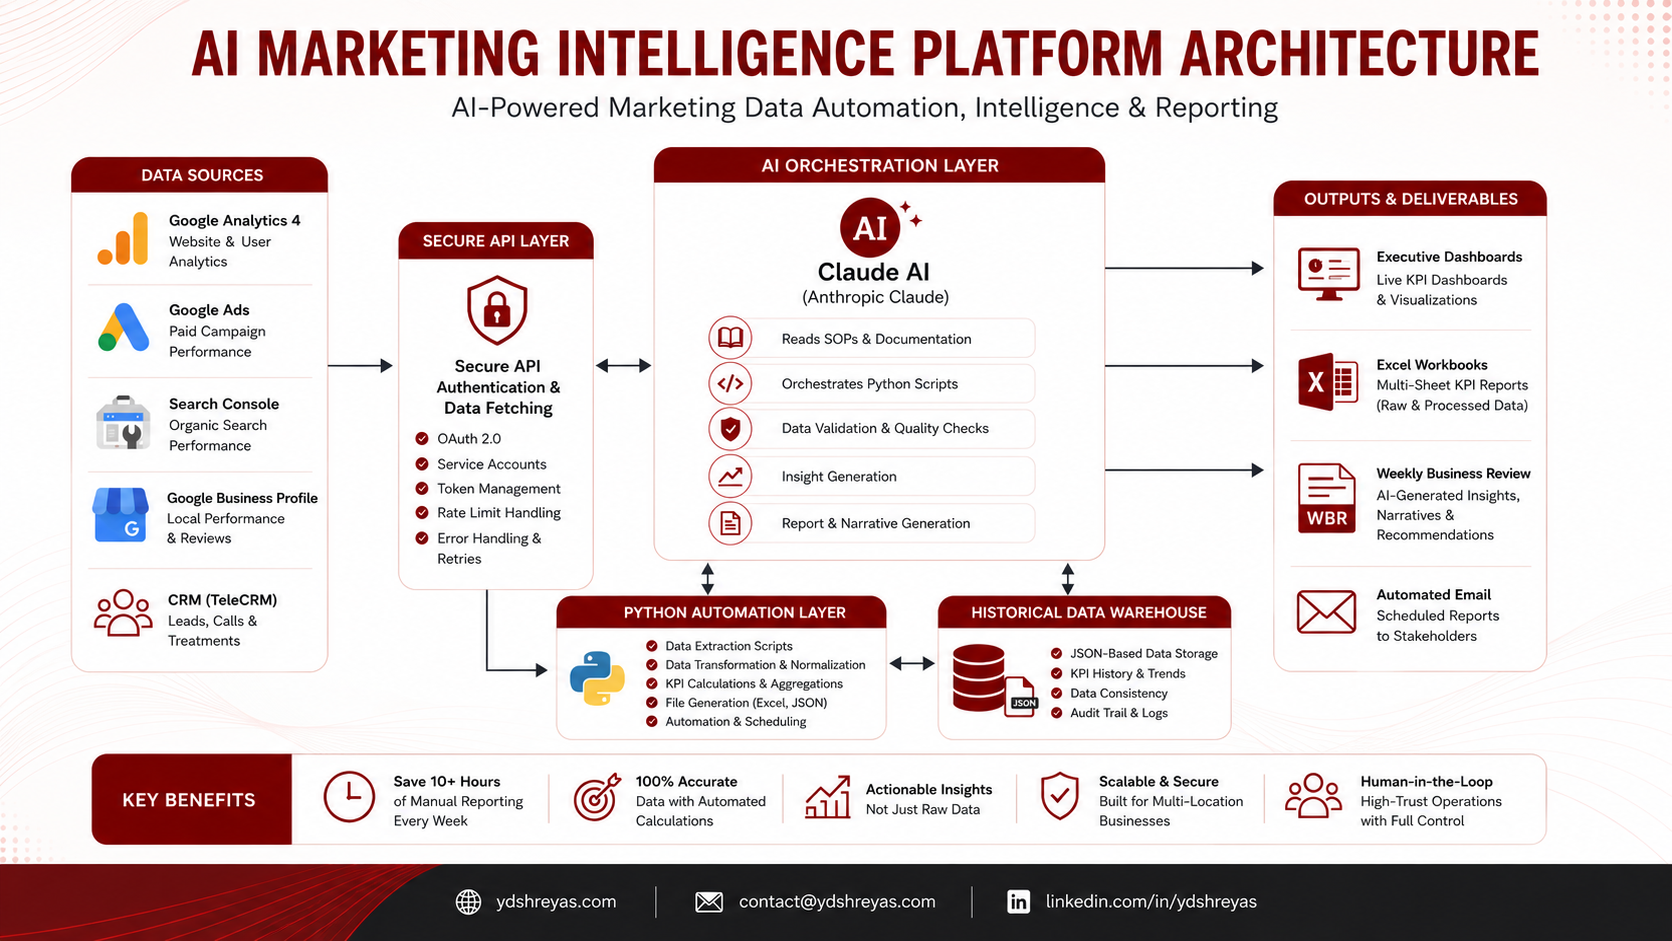
Four marketing data sources feed the system:
Google Analytics 4 — total users, sessions, conversions, an organic-traffic slice filtered by channel group, and five tracked key events (phone call clicks, phone-click-on-website, lead form generation, WhatsApp clicks, and form submissions), each broken out by campaign.
Google Ads— daily spend, clicks, impressions, and conversions at the account, campaign, ad group, and asset group level, across a mix of Search and Performance Max campaigns.
Google Search Console — daily clicks, impressions, click-through rate, and average position for organic search performance, plus a separate query-level breakdown for top search terms by day.
Google Business Profile — per-branch search and maps impressions, call clicks, direction requests, website clicks, and review data across all ten clinic locations.
CRM Layer
A generic CRM layer sits alongside the marketing platforms, exposing leads, customers, pipeline stage, call activity, revenue, and attribution data. This pattern generalizes to any CRM capable of exposing that data through an API — Salesforce, HubSpot, Zoho CRM, LeadSquared, Freshsales, or, as in this build, TeleCRM. In this system, TeleCRM supplies four data types: lead records (4,000+), treatment actions (nearly 15,000), payment events, and a full call log distinguishing inbound, outbound, and missed calls. The CRM layer is what turns marketing metrics into business outcomes — connecting a lead source or campaign not just to a click, but to a booked appointment, a completed treatment, and revenue collected.
Python Automation Layer
Python is the workhorse underneath everything. It handles the parts that require precision and repeatability rather than judgment: authenticating against APIs, paginating through responses, converting cost micros to currency, normalizing inconsistent date formats, validating that a merge didn't silently drop data, and writing formatted output into Excel workbooks and self-contained HTML dashboards. Every script in this system does one job. One python script fetches Google Ads data, while another python script only fetches and writes Google Business Profile data. There is no single monolithic script trying to do everything, which is exactly what makes the orchestration layer's job tractable.
Historical Data Warehouse
Every fetched metric lands in a JSON file, not a database. That choice was deliberate. JSON files are human-readable, diffable in version control, mergeable with plain dictionary logic, and require zero infrastructure — no server, no schema migrations, no connection pooling. For a project running out of a shared folder rather than a hosted environment, that simplicity matters more than the query flexibility a relational database would offer. Each file follows the same shape: a dictionary keyed by date (or by event, then campaign, then date), holding the metrics fetched for that day. The result is a lightweight, append-friendly historical data warehouse spanning from late 2025/early 2026 onward across GA4, Search Console, Google Ads, and all ten Google Business Profile listings.
Claude AI Orchestration Layer
This is the layer that makes the whole system worth calling AI marketing intelligence rather than "a folder of scripts." Claude doesn't generate ad hoc code every time a report is needed. It reads the documented SOP and executes a known sequence:
It fetches GA4 data through the MCP tool for the exact date range the SOP specifies. It fetches Search Console data through the appropriate MCP tool, aware of the specific parameter quirks documented in the SOP (more on that below). It loads the existing historical JSON, merges in only the newly fetched date keys, and writes the file back while never overwriting history. It executes the correct python script in the correct order. It validates that the output looks right, spend sums that aren't zero, CTRs that fall in a sane range before declaring the job done. And it builds the dashboards and reports from the resulting data.
The critical design decision is that none of this is improvised per request. The SOP documents specify the exact tool names, exact parameters, exact merge rules, and exact execution order. Claude follows a defined operational procedure the same way a trained analyst follows a runbook — which is what makes the output consistent from one week to the next, regardless of who asks for it or how they phrase the request.A single marketing operation today touches at minimum four separate systems: an analytics platform (Google Analytics 4), a paid media platform (Google Ads), an organic search platform (Google Search Console), and a local presence platform (Google Business Profile). Layer a CRM on top — Salesforce, HubSpot, Zoho, LeadSquared, Freshsales, or a custom-built system — and you have five systems, none of which talk to each other, each with its own login, its own data model, and its own definition of what a "conversion" or a "lead" means.
For the multi-location business behind this project, that meant a full set of local-listing profiles across several branches, one analytics property, one ads account running a mix of campaign types, one search console property, and a CRM tracking thousands of lead and customer records. None of it lived in one place. None of it was comparable week over week without manual work.
Every Platform Has Different APIs
Beyond the sheer number of platforms, each one exposes data differently. Google Ads returns cost in micros (you divide by 1,000,000 to get currency). GA4 returns dates as YYYYMMDD strings with no separators. Google Search Console's reporting API, in its most common form, has no start_date/end_date parameter at all — it only accepts a lookback window measured in days and a row limit, and if you pass date parameters anyway, it doesn't throw an error. It silently falls back to defaults and truncates your results, which is arguably worse than a hard failure because nothing tells you it happened. Google Business Profile splits performance data and reviews across two different API surfaces entirely, enforces a maximum date-range chunk per call, and reports different metrics on different lags — map-related metrics tend to update same-day, while search-related metrics and interaction clicks can lag several days.
None of these are edge cases. They are the default behavior of the APIs you have to build against, and every one of them is a place where a manual process — or a naive automation script — quietly produces wrong numbers.
Executives Need Business Insights, Not Raw Metrics
None of this raw data is useful to a director or a marketing manager on its own. Nobody in a leadership meeting wants a table of raw dimension filters or micros-denominated cost values. They want to know: how much did we spend, how many leads did that produce, what did each lead cost us, and is that trending up or down compared to last week. Translating several raw data feeds into four or five business-readable numbers — cost per lead, weighted click-through rate, weighted average position, and week-over-week deltas — is where most of the actual manual effort goes, and it's also where manual processes are most error-prone, because these are not simple averages. A weighted average position, for example, has to be calculated as the sum of (position × impressions) divided by the sum of impressions — a simple mean across days is mathematically wrong, and it's an easy mistake to make by hand in a spreadsheet.
Why Traditional Automation Breaks Down
The obvious next step is "just write a script." And to a point, that works — a script that pulls data from an API on a schedule is genuinely useful. But traditional automation breaks down in a specific way: it's brittle in the face of anything that isn't the exact case it was written for. A scheduled job that pulls ad platform data doesn't know what to do when a new campaign launches with a name that doesn't match its hardcoded expectations. A script that overwrites a data file every night silently destroys historical data the moment an API has a bad day and returns partial results. A dashboard generator that assumes a clean, uniform calendar breaks the first time a reporting period boundary falls in the middle of a week.
Traditional automation is also purely mechanical — it has no judgment. It cannot notice that this week's search console numbers look truncated because a parameter was silently ignored. It cannot recognize that a new campaign needs a new row added to a specific report. It executes exactly what it was told, nothing more, which means every new edge case requires a developer to go back into the code. This is the ceiling that traditional marketing automation and most AI marketing automation buzzword products run into: they automate the retrieval, but not the judgment, validation, and adaptation that a human analyst brings to the process.
Why I Built an AI-First Marketing Intelligence Platform
The Original Goal
The initial goal was modest: automate the weekly report so I didn't have to manually copy numbers from multiple platforms into a spreadsheet every week. That's it. A single process, a single output.
Why Python Alone Wasn't Enough
Python alone handles the mechanical part well — API calls, data transformation, writing formatted reports. What Python alone doesn't handle is the orchestration: deciding what to fetch, in what order, how to merge new data with what already exists without corrupting history, how to detect when a data source is returning something off (like an API silently truncating to a default window), and how to adapt to new campaigns, new reporting periods, or new leadership questions without a developer rewriting code every time. A hardcoded script is a snapshot of a decision made once. The actual reporting process needed something that could hold and apply *procedure*, not just *logic*.
Moving from Automation to AI Operations
That's the shift that mattered most in this project: moving from "automation" (a script that does one fixed thing) to AI operations (a system where an AI agent reads a defined procedure, executes the right sequence of tools, checks its own output, and adapts within guardrails). The distinction sounds subtle, but it changes the entire design. Instead of one script trying to handle every case, the architecture became: deterministic scripts that each do one job precisely, and an AI orchestration layer — Claude — that knows which script to run, when, with what inputs, and how to validate what came out.
Treating AI as an Operational Team Member
The mental model that made this work was to stop treating Claude as a code-generation tool and start treating it as an operational team member with a defined role — the same way you'd onboard a new marketing analyst. A new analyst doesn't get a blank slate; they get a documented standard operating procedure: what to fetch, in what order, what the known gotchas are, what "done" looks like. That's exactly what this system gives Claude — a written operating procedure that specifies the exact sequence, parameters, merge rules, and execution order for both the recurring reporting cycle and the on-demand CRM refresh. Claude doesn't guess at the workflow each time; it reads the same operational procedure a human team member would follow.
Marketing Platforms
Four marketing data sources feed the system:
Google Analytics 4 — total users, sessions, conversions, an organic-traffic slice filtered by channel group, and a set of tracked micro-conversion events (things like click-to-call, WhatsApp clicks, and form submissions), each broken out by campaign.
Google Ads — daily spend, clicks, impressions, and conversions at the account, campaign, and ad-set level, across a mix of search and automated-bidding campaign types.
Google Search Console — daily clicks, impressions, click-through rate, and average position for organic search performance, plus a separate query-level breakdown for top search terms by day.
Google Business Profile — per-location search and maps impressions, call clicks, direction requests, website clicks, and review data across every branch location.
CRM Layer
A generic CRM layer sits alongside the marketing platforms, exposing leads, customers, pipeline stage, call activity, revenue, and attribution data. This pattern generalizes to any CRM capable of exposing that data through an API — Salesforce, HubSpot, Zoho CRM, LeadSquared, Freshsales, or a custom in-house system. In this build, the CRM layer supplies lead records, service or engagement history, payment events, and a full call log distinguishing inbound, outbound, and missed calls. The CRM layer is what turns marketing metrics into business outcomes — connecting a lead source or campaign not just to a click, but to a booked engagement and revenue collected.
Python Automation Layer
Python is the workhorse underneath everything. It handles the parts that require precision and repeatability rather than judgment: authenticating against APIs, paginating through responses, converting cost micros to currency, normalizing inconsistent date formats, validating that a merge didn't silently drop data, and writing formatted output into spreadsheets and self-contained HTML dashboards. Every piece of automation in this system does one job. One script only fetches ad platform data. Another only fetches and writes local-listing data. There is no single monolithic script trying to do everything — which is exactly what makes the orchestration layer's job tractable.
Historical Data Warehouse
Every fetched metric lands in a structured JSON file, not a database. That choice was deliberate. JSON files are human-readable, diffable in version control, mergeable with plain dictionary logic, and require zero infrastructure — no server, no schema migrations, no connection pooling. For a project running out of a local, credential-controlled environment rather than a hosted environment, that simplicity matters more than the query flexibility a relational database would offer. Each file follows the same shape: a structure keyed by date (or by event, then campaign, then date), holding the metrics fetched for that day. The result is a lightweight, append-friendly historical data warehouse spanning several months across analytics, search, ads, and every local-listing location.
Claude AI Orchestration Layer
This is the layer that makes the whole system worth calling AI marketing intelligence rather than "a folder of scripts." Claude doesn't generate ad hoc code every time a report is needed. It reads a documented operating procedure and executes a known sequence:
It fetches analytics data through a connected reporting tool for the exact date range the procedure specifies. It fetches search performance data through a separate connected tool, aware of the specific parameter quirks documented in the procedure (more on that below). It loads the existing historical data, merges in only the newly fetched date keys, and writes the file back — never overwriting history. It executes the correct scripts in the correct order to update the reporting workbook and generate dashboards. It validates that the output looks right — spend sums that aren't zero, click-through rates that fall in a sane range — before declaring the job done. And it builds the dashboards and reports from the resulting data.
The critical design decision is that none of this is improvised per request. The documented procedure specifies the exact steps, parameters, merge rules, and execution order. Claude follows a defined operational procedure the same way a trained analyst follows a runbook — which is what makes the output consistent from one week to the next, regardless of who asks for it or how they phrase the request.
How the AI Workflow Actually Operates
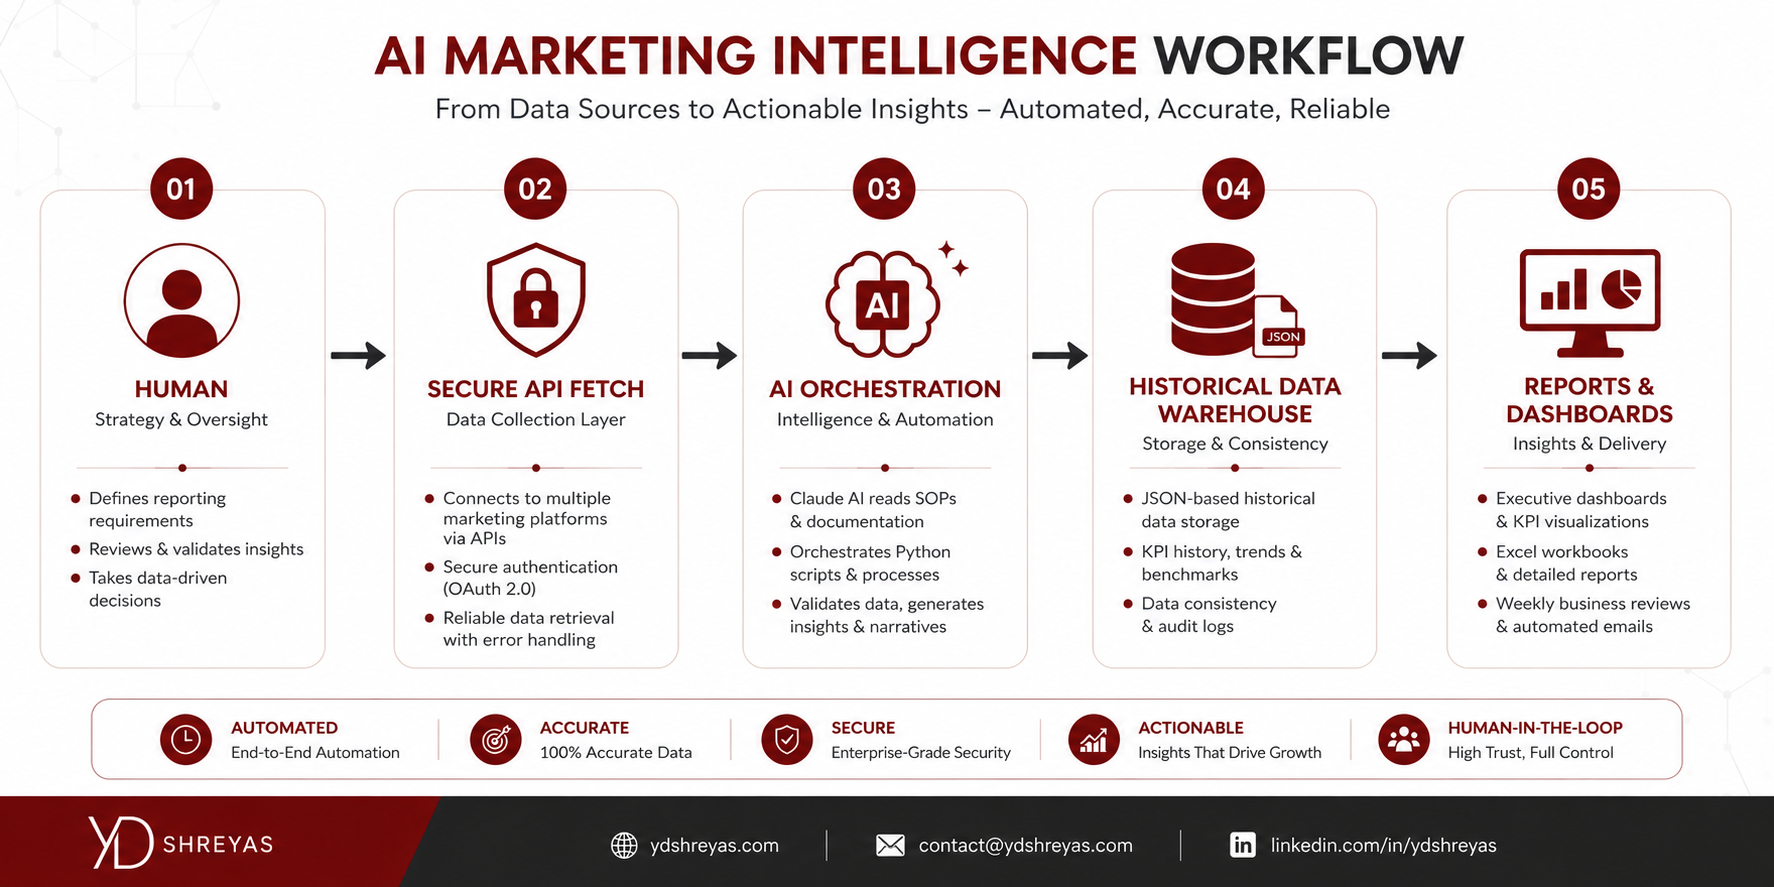
This is the centerpiece of the whole platform: a six-step operational loop that runs every time a report is needed, splitting responsibility cleanly between a human operator and Claude.
Step 1 — Human Executes Secure Operations
Some operations require credentials that shouldn't — and in this environment, technically can't — be handed to an AI agent. Claude's sandbox blocks outbound calls to external APIs that require locally stored OAuth tokens or API keys, which is a feature, not a limitation, for this architecture. Three categories of work stay firmly with the human operator:
Ad platform data retrieval runs through a local script that requires a locally stored API credential file and the platform's official SDK. Local-listing data retrieval runs through a script that requires a full OAuth consent flow with a cached token. CRM data retrieval runs through scripts authenticated with a private access token against the CRM's API. All three are run exclusively by the human operator, from a local machine, before Claude is asked to do anything.
This isn't an arbitrary restriction — it's a deliberate safety boundary. Credentialed, high-trust operations against production ad accounts, business listings, and customer-adjacent CRM data stay under direct human control. Everything downstream of that boundary — reading the data those scripts produced, merging it, computing metrics, generating reports — is where the AI orchestration layer takes over.
Step 2 — Claude Retrieves Marketing Data
Once the human has run the credentialed fetch scripts, Claude picks up analytics and search console retrieval — both accessible through a connector layer without local credentials. Following the documented procedure, Claude calls the analytics tool for the current and prior reporting period, and separately calls it again with a campaign dimension to populate a key-event-by-campaign breakdown. For search console data, the procedure calls out a specific and easy-to-miss bug: the primary search analytics tool has no explicit start/end date parameters at all in its common form — only a lookback window and a row limit, defaulting to a small number of rows over a short window. Passing date parameters doesn't error; it silently falls back to those defaults and can truncate the response before it reaches the most recent, operationally relevant days. The procedure requires Claude to always pass an explicit lookback value large enough to cover the needed range and an explicit, generous row limit — a workaround documented once and then always applied, rather than rediscovered by trial and error on every run.
Every fetch follows a freshness check: is this data actually within the source's known lag window, and does the merge only touch the date keys that were actually just fetched.
Step 3 — AI Builds the Historical Data Warehouse
Before writing anything, Claude loads the existing data file, updates only the specific date keys covered by the current fetch, and writes the merged result back. This "merge-only, never overwrite" rule is applied uniformly across every data cache in the system — analytics totals, campaign-level event data, search console daily metrics, and the query-level breakdown. It's a simple rule, but it's the one that makes the historical warehouse trustworthy: a bad or partial fetch on any given day can never silently erase months of prior data, because the write path physically cannot touch a date key it didn't just fetch.
Step 4 — Claude Executes the Reporting Pipeline
With fresh, merged data in place, Claude runs the deterministic pipeline in a fixed order. A workbook-population step reads every data cache and writes computed values into the correct sections of the live reporting workbook — ad platform metrics, analytics totals, search metrics, and the key-event breakdown — while explicitly never touching any pre-built formula columns used for period totals. A dashboard-generation step then reads the freshly updated workbook (not the raw data caches directly) and builds a multi-section HTML executive dashboard. A daily-brief step builds a lightweight this-period-versus-last-period comparison straight from the data caches, for use on any day, not just a fixed reporting day. A weekly-comparison step builds the equivalent comparison for two complete prior periods, reusing the same report-building logic as the daily brief but with fully closed date windows.
Step 5 — AI Validates Business Metrics
Before calling a run complete, the pipeline computes — and Claude checks the sanity of — the metrics that actually matter to a marketing director rather than raw counts. Click-through rate is always recalculated from clicks divided by impressions rather than trusted from a stored field, because a source API's own stored figure can be stale relative to the underlying counts. Average position is computed as an impression-weighted average, never a simple mean, because a simple mean over-weights low-traffic days. Cost per lead is spend divided by conversions, computed fresh from the same daily totals that feed every other ad metric, so it's always internally consistent with the spend and lead numbers sitting next to it. Organic traffic and campaign-level metrics get the same treatment: computed, not copied, from the merged daily data.
Step 6 — AI Generates Executive Reports
The final step produces the artifacts a human actually looks at: the updated reporting workbook, a dated snapshot copy for sharing with stakeholders (the live working file is never shared directly), a daily marketing brief, a multi-section executive dashboard, a weekly comparison dashboard, and — on a separate on-demand cadence — a CRM performance dashboard and a lead-touch summary report pulled from the CRM data.
Inside the Reporting System
Weekly Business Review
The WBR is a multi-section reporting workbook that is the single source of truth for the entire operation. It covers a full calendar year of weekly detail, with every reporting week following a consistent day-of-week boundary and splitting automatically at month boundaries — meaning a week that spans the end of one month and the start of the next shows up as two separate segments rather than distorting either month's totals. It includes a summary section giving a one-page executive view across all four channels, a campaign detail section with both a current-period snapshot and a longer-term spend-and-leads trend per campaign, a dedicated paid-media section, an organic-search section, a per-location section covering every branch, a flat review log, and a section breaking out event counts and matched ad spend for a handful of conversion-relevant actions.
Daily Marketing Brief
A lightweight, on-demand HTML report comparing the current period-to-date against the equivalent partial period previously, across ad platform, analytics, search console, and combined local-listing performance. Because a partial period is never a full comparison window, every comparison uses daily averages rather than raw totals, so a mid-week check-in isn't unfairly compared against a full prior period.
Executive Dashboard
A multi-tab, self-contained HTML dashboard generated from the reporting workbook itself, not from the raw data caches — which means it always reflects exactly what's in the shared workbook. It includes year-to-date KPI cards, monthly trend charts, a period-over-period percentage change table, weekly operational detail per channel, a campaign performance tab, and a local-listing-and-reviews tab broken out by branch.
CRM Performance Dashboard
Built from the CRM's raw lead cache and call log, this dashboard shows lead volume over time, lead status distribution, lead source breakdown, payment collection by location, service or engagement type distribution, and inbound/outbound/missed call activity, with support for excluding locations that are no longer operational from CRM-side reporting even if their local-listing profile is still technically active.
Campaign Performance Reports
The campaign detail section and its corresponding dashboard tab track every ad campaign at both a current-snapshot level (impressions, clicks, spend, click-through rate, average cost-per-click, conversions, cost per lead) and a longer-term trend level, with automated-bidding campaigns broken out by asset group where manually structured search campaigns are broken out by ad group — reflecting the actual structural difference between those campaign types in most ad platforms.
Branch Performance Reports
Both the local-listing section of the workbook and the corresponding dashboard tab report every metric per branch location, alongside a combined total — letting a marketing manager see at a glance which specific locations are driving impressions, calls, and direction requests, rather than only a blended account-wide number.
Why AI Was the Most Important Technology in This Project
Python, the Google APIs, and the JSON warehouse are all necessary, but none of them are what made this a marketing intelligence platform rather than a script folder. Claude filled six distinct roles across the build and the ongoing operation of the system.
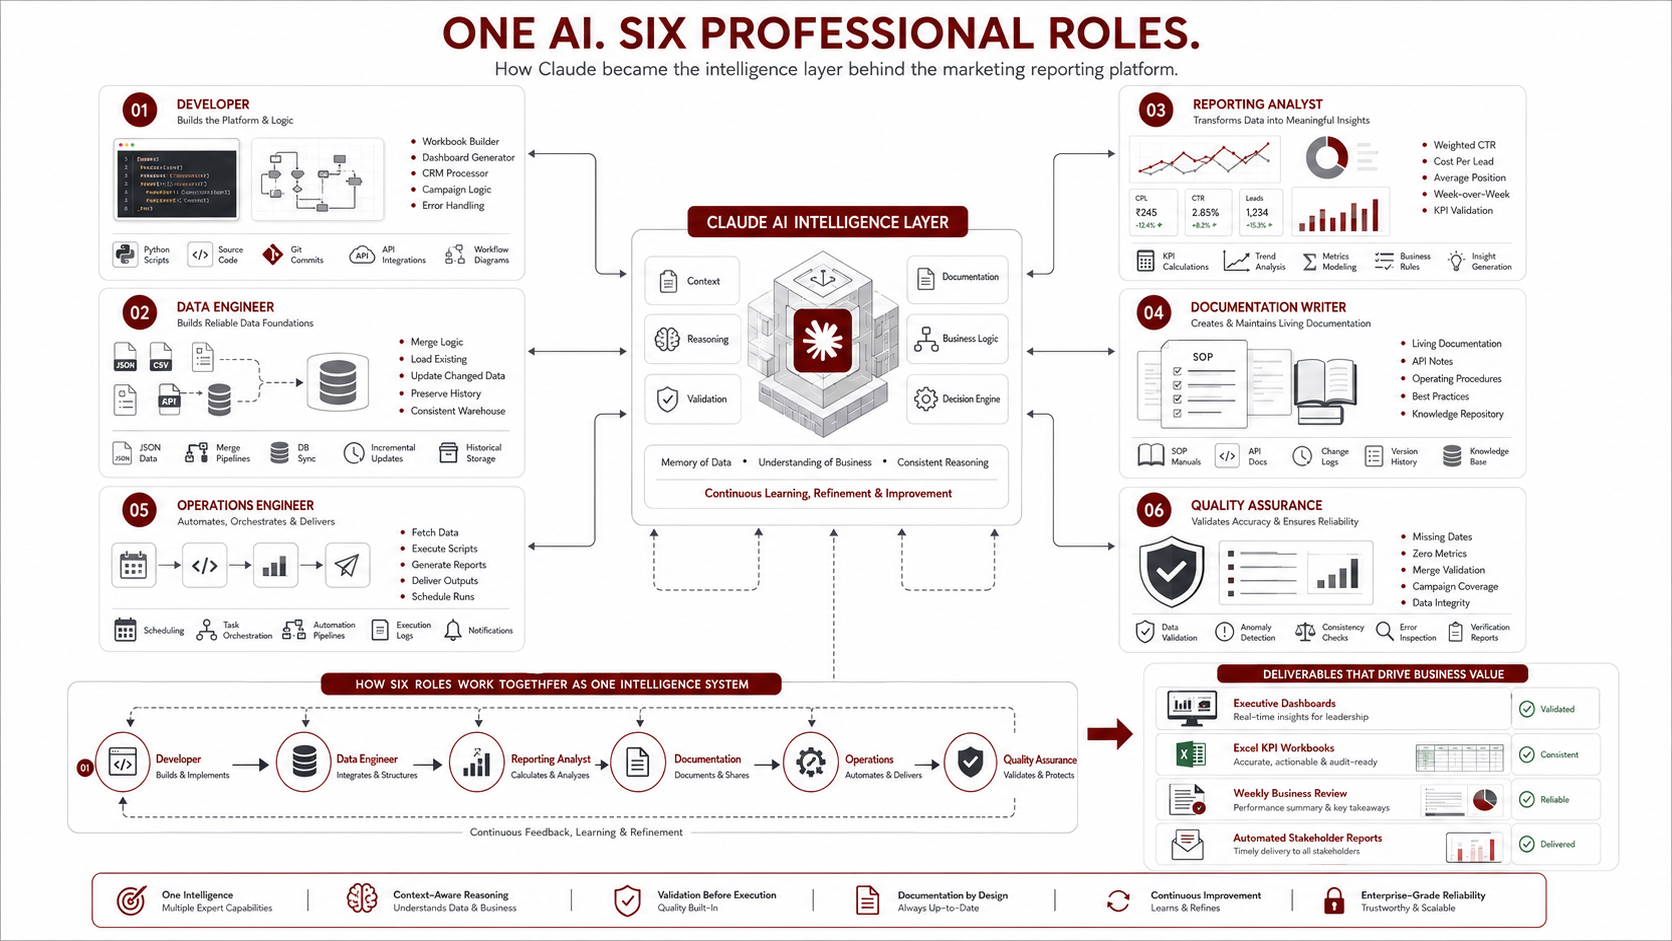
Claude as a Developer
Every piece of automation in the system — the workbook builder, the dashboard generators, the CRM data processor — was built collaboratively with Claude, iterated against real data until the edge cases (period boundaries, naming mismatches between platforms, structural differences between campaign types) were handled correctly.
Claude as a Data Engineer
Claude designed and maintains the merge logic that keeps the JSON historical warehouse consistent: load-existing, update-only-fetched-keys, write-back, applied identically across every data source so that a partial fetch never corrupts prior history.
Claude as a Reporting Analyst
Claude computes the business-facing numbers — weighted click-through rate, weighted average position, cost per lead — the same way a trained analyst would, rather than trusting a source API's potentially stale stored field.
Claude as a Documentation Writer
The operating procedures that make this whole system repeatable were written and are actively maintained as living documentation — updated the same day a new API quirk is discovered, so the fix is captured once and never has to be rediscovered.
Claude as an Operations Engineer
Claude executes the actual recurring and on-demand runs: fetching, merging, running the correct scripts in the correct order, and delivering the finished artifacts — the operational role a marketing operations hire would normally fill.
Claude as a Quality Assurance Layer
Before calling any run complete, Claude checks that fetched data actually landed correctly — that a merge didn't drop dates, that a metric isn't suspiciously zero because of a silent API default, that a new campaign didn't fail to get a row in the campaign breakdown. This is the layer that catches the class of error that traditional automation, having no judgment, simply cannot catch.
Engineering Decisions That Made the Platform Scalable
Using JSON as a Data Warehouse
Choosing flat structured data files over a database traded query flexibility for simplicity, portability, and zero infrastructure overhead — the right trade for a project that needs to be inspectable, versionable, and runnable without a hosted backend.
Merge Instead of Replace
Every write path in the system merges into existing data rather than replacing it wholesale. This single rule is what makes the historical warehouse trustworthy across months of operation, because no single failed or partial run can silently erase prior history.
Separating Fetch Scripts from Reporting Scripts
Data retrieval is cleanly separated from reporting generation. Each script does one job, which keeps the orchestration layer's decisions simple and each failure mode isolated to a single, identifiable step.
Making Dashboards Stateless
The dashboard generator reads the reporting workbook fresh every time rather than caching any intermediate state, and derives its period-to-column mapping directly from the same configuration the workbook builder uses — so when a new reporting period's columns are added in one place, the dashboard picks them up automatically with no separate update required.
Dynamic Weekly Business Reviews
The workbook's reporting periods follow a strict, consistent weekly boundary rule, with month-boundary periods automatically split rather than assigned arbitrarily to one month — preserving accurate monthly totals even when a calendar week straddles two months.
Handling Month Boundary Logic
This turned out to be one of the trickiest pieces of the entire system: any process that aggregates by month has to correctly attribute a split period's data to the right side of the boundary, and the documented procedure explicitly instructs that a reporting update can run on any day, using today's date as the end boundary — never gated on a fixed day of the week.
Weighted Metric Calculations
Click-through rate and average position are both metrics where a naive average produces a wrong (and often misleadingly optimistic or pessimistic) number. The system always recomputes click-through rate from raw clicks and impressions, and always computes average position as an impression-weighted mean — a small implementation detail with an outsized effect on whether leadership trusts the numbers.
Designing SOPs for AI Execution
The single decision with the highest leverage in this entire project was writing explicit, versioned operating procedures specifically for Claude to execute against — not developer documentation, not a wiki page, but operational runbooks with exact steps, parameters, merge rules, and execution order. This is what turned "ask an AI to help with reporting" into a reliable, repeatable operational system. Explicit documentation is what let Claude execute the same workflow correctly whether it was the first run or the fiftieth.
Challenges I Faced
API Authentication
The ad platform requires a locally stored credential file; the local-listing platform requires a full OAuth browser consent flow with a token that needs periodic re-authentication; the CRM requires a private access token. None of these can run inside Claude's sandboxed environment, which shaped the entire human-versus-AI division of labor in this system from day one.
Google Ads API Limitations
The connector tool used for ad hoc ad-platform queries has several sharp edges: certain filter and sort parameters that crash the tool outright, and a tendency for date-segmented campaign-level queries to explode into an unpredictable number of rows. The workaround was to avoid the unstable parameters entirely (filtering and sorting client-side instead), and to only use date segmentation on the query types where it behaves safely — routing all other date-scoped ad data through a dedicated local script instead of the connector tool.
Search Console Data Lag
Search console data lags roughly one to a few days depending on the day tested, and the primary connector tool for pulling it has no date-range parameters at all in its common form — a bug that fails silently rather than loudly, which made it genuinely dangerous until it was documented and worked around with explicit lookback and row-limit values.
Campaign Mapping
Ad platform campaign names as they appear in the platform's own UI don't always match the cleaned identifiers used internally in the data files, requiring a mapping step to bridge the two. This is a known piece of design debt worth planning around from day one: pick one naming convention before writing any fetch script, because retrofitting one later is far more work.
Historical Data
Backfilling months of historical data across four channels and every branch location, before the merge-based warehouse existed, required careful sequencing — some channels had sparser early-period data than others, and getting a clean historical baseline meant separate backfill fetches rather than assuming the standard incremental fetch would catch everything.
Human vs AI Responsibilities
Drawing the line correctly between what a human must run (anything requiring locally stored credentials or OAuth) and what Claude can run (anything reachable through a connector) took real iteration. Getting this boundary wrong in either direction either creates a security risk or creates unnecessary manual bottlenecks.
Prompt Engineering
The lesson that mattered most here wasn't about clever prompt phrasing at all — it was that prompt engineering became largely unnecessary once the documented procedure existed. Instead of crafting a careful prompt every time, the operator says something as simple as "give me the weekly update," and Claude executes the documented procedure. The engineering effort moved from prompt design into procedure design.
Building Repeatable Workflows
The recurring theme across every challenge above is the same: a one-off fix is not a solution. Every bug, gotcha, or edge case discovered during this build was written into the operating procedure the same day it was found, so it becomes institutional knowledge the system applies every time going forward, rather than a lesson that has to be relearned.
Results
Since this system replaced the manual reporting process, the improvements have been consistent and qualitative rather than requiring a formal before/after study. Reporting cycles that used to require manually cross-referencing four platforms now run as a documented sequence executed largely by Claude, with the human operator only running the credentialed fetch scripts. Manual data entry and copy-paste work across the workbook, dashboards, and briefs has been effectively eliminated for routine runs. Data consistency has improved meaningfully, because every derived metric — click-through rate, average position, cost per lead — is computed the same way every time from the same merge-protected historical data, rather than recalculated by hand with room for error. The platform now holds a genuine historical record across analytics, search, ads, and every local-listing location going back several months, which supports trend analysis that a purely manual, week-by-week process never could. Reports delivered to leadership — the dated snapshots, the executive dashboard, the daily brief — are consistently formatted and ready to share without additional cleanup. The operating procedure itself has become an asset in its own right, capturing every known API quirk and workaround so they never have to be rediscovered. And context switching has dropped substantially: rather than manually operating five different platforms, the operator now runs a small number of credentialed scripts and hands the rest to Claude.
Lessons Learned About Building AI Systems
This is the section that makes this build worth writing about, beyond the specific channels and platforms involved.
AI is most valuable when it is embedded into a workflow, not just used to generate code. The value in this system doesn't come from Claude having written the automation scripts — plenty of automation gets built that way and still requires a human to babysit every run. The value comes from Claude being the thing that runs the workflow week after week, reading the same documented procedure, catching the same class of error, every time.
SOPs are as important as the software itself, because they define how humans and AI actually collaborate. A script without a documented procedure around it is just code sitting in a folder. The procedure is what turns that code into an operational system that a non-developer can trigger with a single sentence and trust to behave the same way every time.
Separating secure operations from AI-executed tasks improves both safety and repeatability. Keeping OAuth flows, API keys, and CRM access tokens firmly on the human side of the line — not because Claude couldn't technically be given them, but because that boundary is the right one for credentialed, high-trust operations — turned out to also make the system more reliable, because the failure modes on each side of that line are cleanly separated and independently debuggable.
Treating AI as an operational collaborator, rather than a code generator you consult occasionally, changes how you design the rest of the system. Once Claude is a standing part of the operational loop, the natural design instinct shifts toward writing things down precisely — because a documented procedure is what lets an AI collaborator execute reliably, and it turns out that same precision is exactly what makes a system maintainable for the next human who touches it too.
What's Next
There's a clear roadmap for extending this platform further into autonomous, always-on marketing intelligence. Scheduled cloud execution would remove the remaining manual trigger step for the parts of the workflow that don't require local credentials. Vector search over historical reports and past snapshots would let a marketing director ask a natural-language question about how a metric trended over recent months and get an answer grounded in the actual historical warehouse, rather than manually paging through spreadsheet tabs. Natural-language querying over the data warehouse directly is a logical extension of the same idea. Predictive analytics — forecasting cost per lead or organic traffic trends from an accumulating historical baseline — becomes feasible once enough history has built up. Multi-agent collaboration could split the current single-orchestrator model into specialized agents per channel, coordinating through the same shared data warehouse. LLM-powered anomaly detection could flag a sudden cost spike or an impression drop automatically, rather than waiting for a human to notice it in a weekly review. And voice-based executive summaries could turn the weekly brief into something a busy operator consumes on a commute rather than reads in a spreadsheet.
Final Thoughts
It's tempting to describe this project as "I automated our marketing reports." That undersells what actually happened. What this project really is is an example of designing an AI-first operating model, not simply bolting automation onto an existing manual process. The combination that made it work wasn't any single piece — not the automation scripts alone, not the Google APIs alone, not Claude alone — but the way documented workflows, deterministic scripts, and an AI orchestration layer were combined into a system where each piece does the part it's actually good at. Python and the APIs handle precision and repeatability. The data warehouse handles memory. Claude handles judgment, sequencing, and adaptation, working from documented procedure rather than improvisation. And the human operator retains direct control over every credentialed, high-trust operation — OAuth flows, API keys, CRM access tokens — by design, not as an afterthought.
That's the real template here: not "replace the marketing team with AI," but build a system where AI and human responsibilities are drawn deliberately, documented explicitly, and executed reliably — a repeatable AI marketing intelligence platform that still knows where the human belongs in the loop, and one you could design a version of for your own business using nothing more than the architecture described above.
FAQ
What is an AI Marketing Intelligence Platform?
An AI marketing intelligence platform is a system that combines automated data retrieval from marketing and CRM sources with an AI orchestration layer that executes documented procedures — fetching, merging, validating, and reporting on marketing performance — rather than requiring a human to manually operate each data source and compile results by hand.
How can Claude automate marketing reporting?
Claude can automate marketing reporting by reading a documented standard operating procedure, executing the correct sequence of connector calls and scripts to fetch and merge data from platforms like Google Analytics and Search Console, computing business metrics, and generating the finished reports — while credentialed operations requiring OAuth or API keys remain with a human operator.
Can AI replace manual reporting?
AI can replace the manual, repetitive parts of reporting — data retrieval, merging, calculation, and report generation — but in a well-designed system, it doesn't replace human oversight of credentialed operations or the judgment calls around what gets reported and how it's interpreted for leadership.
Can AI work with Google Analytics?
Yes. Through the Google Analytics Data API and connector tools, an AI agent like Claude can run GA4 reports, fetch dimensions and metrics such as users, sessions, and conversions, and merge that data into a historical record for ongoing analysis.
Can AI integrate with CRM systems?
Yes, provided the CRM exposes an API. Systems like Salesforce, HubSpot, Zoho CRM, LeadSquared, and Freshsales can all feed lead, pipeline, call, and revenue data into an AI-orchestrated reporting pipeline, though CRM API calls requiring locally stored auth tokens are often best run by a human operator for security reasons.
Can AI generate executive dashboards?
Yes. An AI orchestration layer can execute the scripts that transform raw and merged data into self-contained HTML dashboards, complete with KPI cards, trend charts, and period-over-period comparisons, without a human needing to build each chart manually.
How do AI agents automate business workflows?
AI agents automate business workflows by following documented procedures — reading standard operating procedures, calling the appropriate tools and scripts in the correct order, validating outputs, and adapting to known edge cases — rather than executing a single fixed script with no judgment layer.
Can Python and AI work together?
Yes — and in most production systems, they should. Python handles precise, repeatable mechanical work (API calls, data transformation, file writes), while an AI orchestration layer handles sequencing, validation, and adaptation, calling the right scripts at the right time with the right inputs.
What is AI orchestration?
AI orchestration is the practice of using an AI agent to coordinate a sequence of tools, scripts, and data sources toward a defined outcome — deciding what to run, in what order, validating results, and handling known exceptions — rather than using the AI only to generate code or answer isolated questions.
How do you build an AI-powered reporting system?
Start by separating data retrieval from report generation into distinct, single-purpose scripts. Store historical data in a format that supports safe incremental merging. Write explicit documented procedures for the AI to follow. Draw a clear line between credentialed operations a human must run and connector-accessible operations the AI can run. Then let the AI orchestrate the sequence, validate outputs, and generate the final reports.
What is a Weekly Business Review (WBR)?
A Weekly Business Review is a recurring report — typically a structured spreadsheet or dashboard — that tracks key business metrics on a weekly cadence for leadership review, often including current performance, trends over time, and comparisons against prior periods or goals.
Why use JSON instead of a database?
JSON files offer simplicity, human readability, easy version control diffing, and straightforward merge logic without requiring database infrastructure, schema migrations, or connection management — a strong trade-off for a project where data volume is moderate and inspectability matters more than complex querying.
External references: Anthropic Claude documentation · Model Context Protocol (MCP) · Google Analytics 4 API · Google Ads API · Google Search Console API · Google Business Profile API · Python · OpenPyXL